Plotly Dash and QuantLib - Vanilla Options
Building an Interactive Options Pricing Engine with Dash and QuantLib.
The objective of this post is to examine the implementation of a stock options pricing application built with QuantLib and Plotly Dash. The application is available at the following URL, and the source code can be found on GitHub:
Live Application: https://options.plotly.app
Source Code: https://github.com/mkipnis/DashQL
1. Objective
The goal of this project is to go over an interactive stock options pricing system that exposes QuantLib’s pricing engines through a browser-based interface. The application integrates QuantLib for instrument construction and valuation with Plotly Dash for reactive UI and visualization.
2. Functionality
The application allows the user to select an underlying instrument, automatically retrieve the relevant volatilities, and display the volatility smiles and surfaces on the screen. It then prices the options and calculates the Greeks. When the user updates the underlying prices or volatilities, the system recalculates the option prices and Greeks in real time.
Key functionalities:
User selects an underlying instrument.
System retrieves market volatilities for the selected instrument.
Displays volatility smiles and surfaces visually.
Prices options and computes Greeks (Delta, Gamma, Vega, Theta, Rho).
Updates prices and Greeks dynamically when inputs change
3. Dataflow
3.1 Startup
Upon application startup or page reload, the following callback is invoked. This callback sets QuantLib’s evaluation date, retrieves the relevant market data, and outputs the sample data:
@app.callback(
     Output("eval-date", "children"),
     Output("underlying-symbol-market-data", "data"),
     Output("vol-market-data", "data"),
     Output("risk-free-rates", "data"),
     Input("startup", "n_intervals"),
)
def setup_options_monitor(_):
    debug_messages = []
    underlying_symbol_data = []
    risk_free_rates = []
Outputs
Output("eval-date", "children") Displays the current QuantLib evaluation date in the top-right corner of the screen. This ensures all pricing and risk calculations are clearly tied to a specific valuation date.
Output("underlying-symbol-market-data", "data") Populates the Underlying Market Data panel (S&P 100 universe) with the latest prices and dividend information, providing the foundational inputs required for option valuation.
Output("vol-market-data", "data") Initializes the Volatility Panel with the default volatility market data, which is used to construct the volatility surface for pricing and risk calculations.
Output("risk-free-rates", "data") Propagates the risk-free rate data to the Options Panel, where it is used as a core input in option pricing models.
3.2 Underlying symbol market data (S&P 100)
The Underlying Symbol Market Data panel consumes "underlying-symbol-market-data" and displays the symbols, prices, and dividends in a grid. Upon selecting an underlying symbol, the selection is propagated to other components in the application. The panel also allows users to modify prices and dividends, enabling dynamic option repricing.
UnderlyingSymbolMarketDataPanel.py
Callbacks
Market Data Grid - Consumer
@self.app.callback(
      Output(self.user_market_data_id, "data"),
      Input("underlying-symbol-market-data", "data"),
      State(self.user_market_data_id, "data"),
      Input(self.market_data_grid_id, "rowData"),
      prevent_initial_call=True )
def on_market_data_update(portal_market_data, user_market_data, row_data):
Market Data Grid - Producer - Symbol selector, price, dividend updates
@self.app.callback(
      Output("selected-underlying-symbol", "data"),
      Input(self.market_data_grid_id, "selectedRows"),
      Input(self.market_data_grid_id, "cellValueChanged"),
      State("selected-underlying-symbol", "data"),
      prevent_initial_call=True )
def on_row_selected_updated(selected_rows, user_market_data, current_symbol):
Outputs
Output("selected-underlying-symbol", "data") - Returns the selected underlying symbol, including its current price and dividend, which are used as inputs in the option pricing calculations.
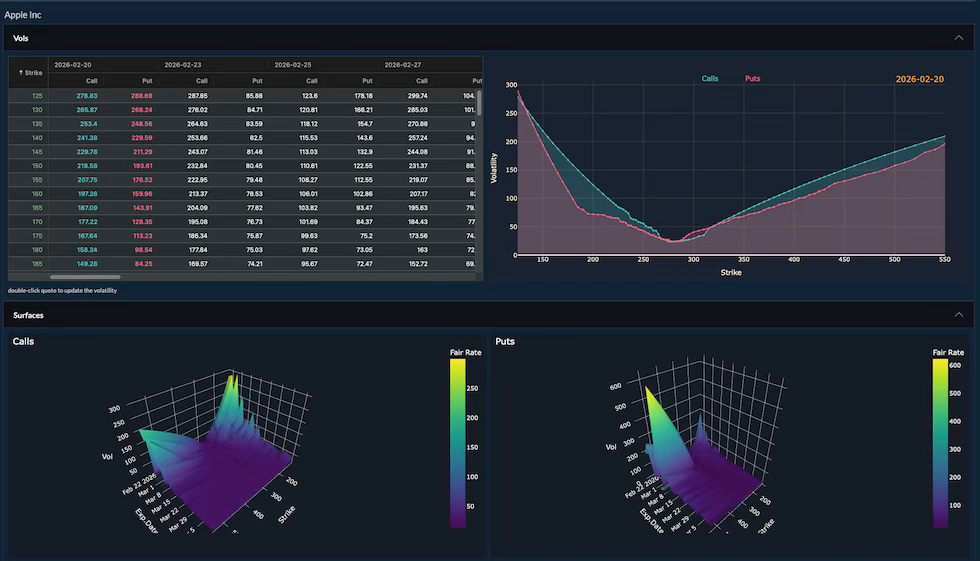
3.3 Volatility Panel
The Volatility Panel consumes "vol-market-data" and "selected-underlying-symbol" as inputs. It displays the volatility surface both in a grid and in a chart. Users can update volatility values directly in the grid and select different expiration dates by clicking on the corresponding columns.
Callbacks
Volatility Grid Data - Consumer
@self.app.callback(
      Output("expiration-dates", "data"),
      Output(self.vol_panel_grid_id, "columnDefs"),
      Output(self.vol_panel_grid_id, "rowData"),
      Input("selected-underlying-symbol", "data"),
      Input("vol-market-data", "data"), )
def populate_underlying_symbol_vol_data(underlying_symbol, vols):
Volatility Grid Data - Expiration Date Change
@self.app.callback(
      Output("selected-expiration-date", "data"),
      Input(self.vol_panel_grid_id, "cellClicked"),
      Input("expiration-dates", "data"),
      State("selected-expiration-date", "data"),
      prevent_initial_call=True, )
def on_cell_clicked(cell, expiration_dates, current_expiration_date):
Volatility Grid Data - Producer - Volatilities
@self.app.callback(
      Output("selected-expiration-vols", "data"),
      Output("vol-panel-graph", "figure"),
      Input("selected-expiration-date", "data"),
      Input(self.user_vol_market_data_id, "data"),
      prevent_initial_call=True, )
def update_graph(expiration_date, user_market_data):
Outputs
Output(”selected-expiration-vols”, “data”) - Returns the volatilities for a given expiration date, which are used as inputs in the option pricing calculations.
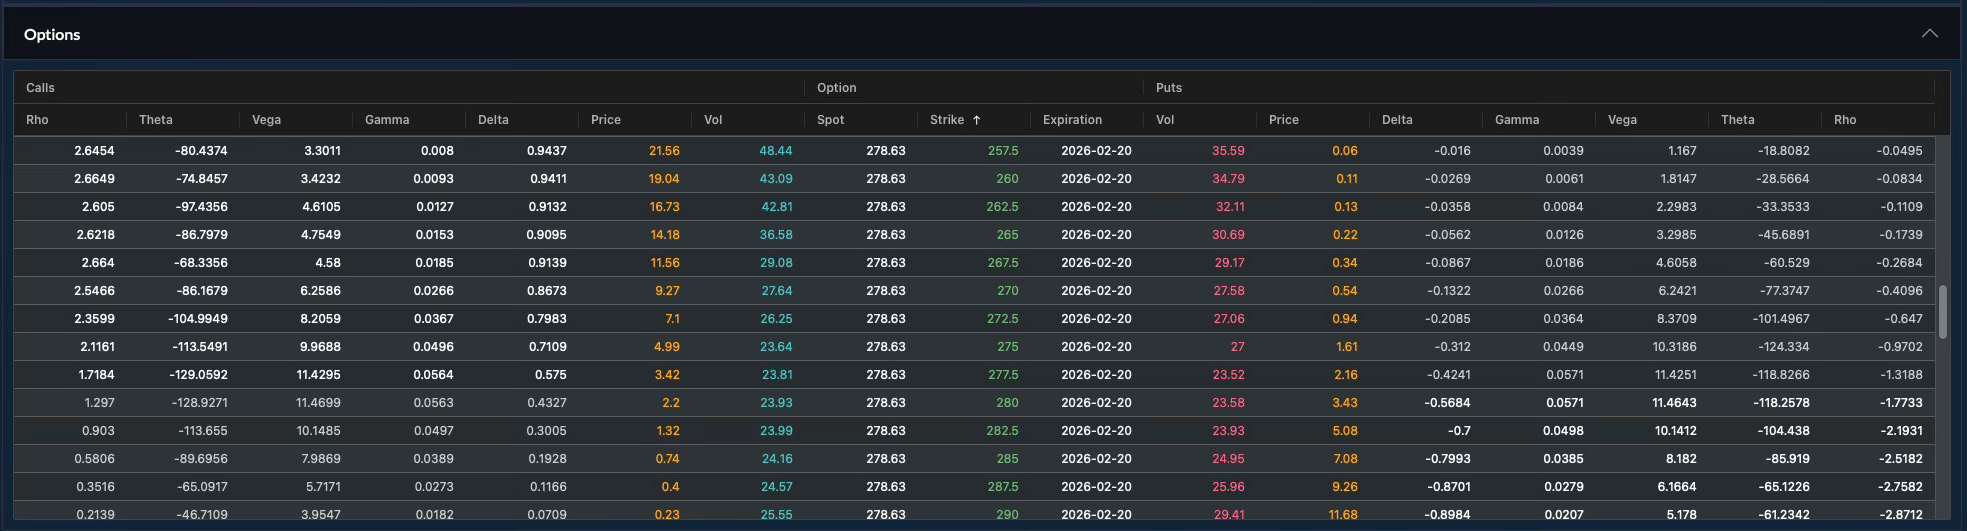
3.4 Options Panel
The Options Panel consumes "underlying-symbol-market-data", "selected-expiration-vols", and "risk-free-rates" as inputs. It initializes the option contracts for the selected expiration and strikes, then calls the pricing model to compute the option price and Greeks for each specified strike.
Callbacks
Options - Setup options - Straddle
 @self.app.callback(
            Output("options-panel-grid", "rowData"),
            Output(f"{self.prefix}-reset-scroll", "data"),
            Input(f"{self.prefix}-symbol", "data"),
            Input("selected-expiration-vols", "data"),
            prevent_initial_call=True,
        )
def setup_options(selected_instrument, selected_exp_vols):
Options - Price options
  @self.app.callback(
            Output("options-panel-grid", "rowTransaction"),
            Output(f"{self.prefix}-atm-strike", "data"),
            Output(self.error_prefix_id, "data"),
            Input(f"{self.prefix}-symbol", "data"),
            Input("options-panel-grid", "rowData"),
            Input("eval-date", "children"),
            Input("risk-free-rates", "data"),
            prevent_initial_call=True,
        )
def price_options(symbol, row_data, eval_date, risk_free_rates):
Options Pricer Code: VolUtils.py
Conclusion
Plotly Dash provides a Python-native framework for building reactive, browser-based analytical applications without requiring JavaScript or frontend frameworks. Its callback architecture allows UI components to respond automatically to state changes, making it well suited for financial workflows where pricing and risk metrics must update immediately as market inputs change.
In this project, Dash manages application state, data propagation, and visualization, while QuantLib performs the valuation. Dash’s integration with interactive components (such as data grids and volatility charts) enables seamless user interaction with market data, volatility surfaces, and option contracts in real time.
The system organized as follows:
Underlying price inputs - UnderlyingSymbolMarketDataPanel.py
Volatility inputs - VolPanel.py
QuantLib pricing - VolUtils.py
By combining Dash’s reactive UI model with QuantLib’s pricing engines, the application delivers a compact, extensible equity options analytics platform implemented entirely in Python.